Another try at 30-90 day epidemic forecasting
This time assume the following:
a) the USC seroprevalence value of 4% as truth on April 10th. Call that 4% population wide and call it the recovered population on that date
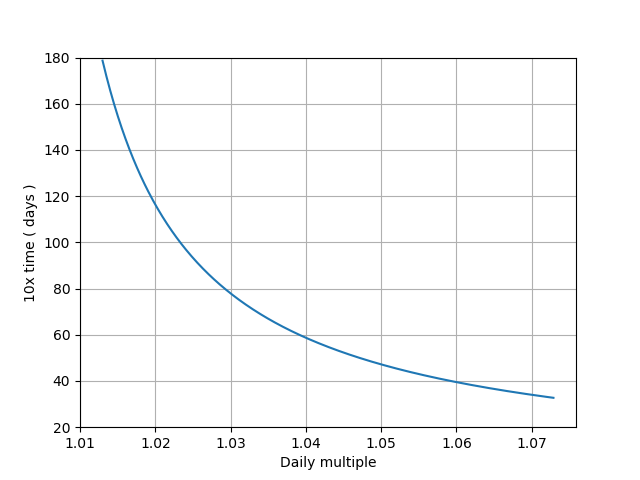
b) Assume that between April 10th and now, certainly in LA, the growth rate is the same as the growth rate of the actual recorded cases: 1.044 daily
c) The last assumption is actually exactly correct early in the epidemic. All the compartments grow at the same exponential rate ( R, S, I and E )
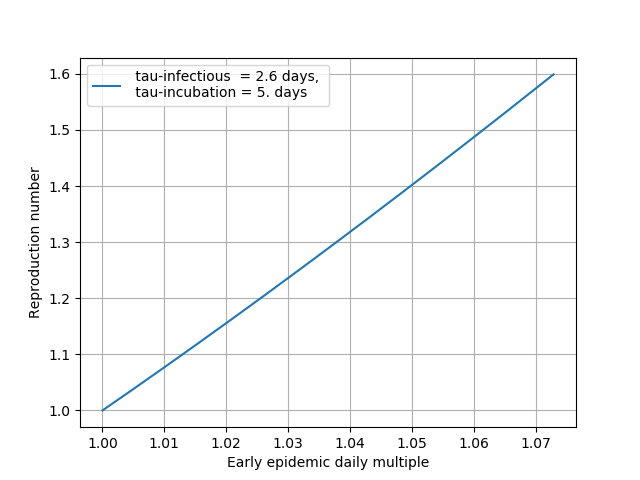
d) Use 5 days for the incubation period. 2.6 days for the infectious period
e) The eigenvalues of the EI subsystem of SEIR are calculated from the times above and the observed exponential rate of recorded cases ( this is location specific and so is strictly speaking the current seroprevalence. many parts of the country are behind in epidemic start )
f) for LA, for the positive eigenvalue one gets: 22.7 days and for the negative 1.6 days
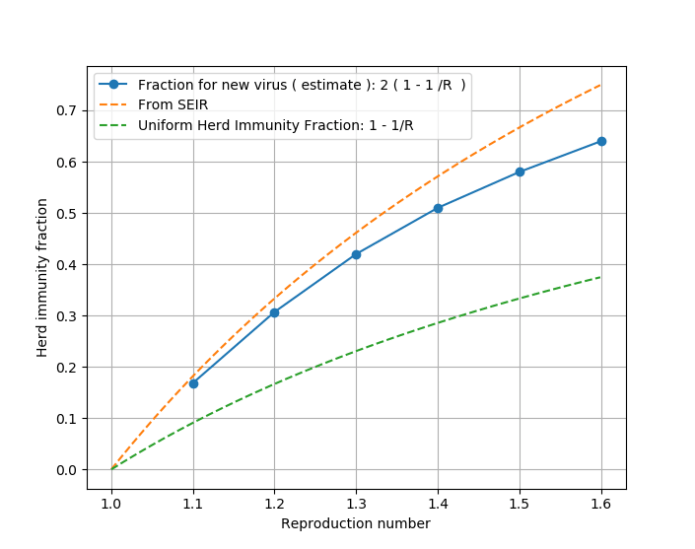
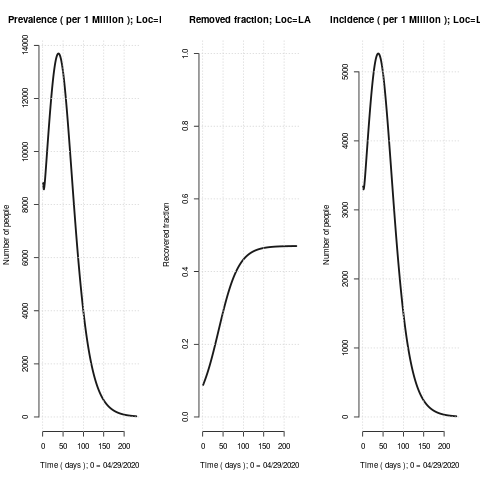
Some figure of merit plots, python setup and post-processing code and SEIR setup for R is attached below. This time the test and trace looks much less hopeful ( certainly in LA ) and that region is headed for ~0.47 herd immunity fraction with peak prevalence of 1.4% 39 days away and 40% cumulative infections ( completed ) in 83 days. The assessed current recovered fraction of the population is 9%
g) The same methodology can be repeated for any region with some care in the formulation for cases where the current prevalence is beginning to reach 10%